


The Trengo for Sales Dashboard offers real-time insights into your sales teams’ current workload and pipeline performance. From here you can track key sales metrics to stay informed about incoming revenue, at which stage leads are falling out of the funnel and how long it takes leads to convert to a won deal. Use it to stay on top of your sales team performance, identify trends, and make informed decisions. For more details on each metric and how to use them effectively, explore the respective deep dive pages linked within the dashboard.
Key Metrics
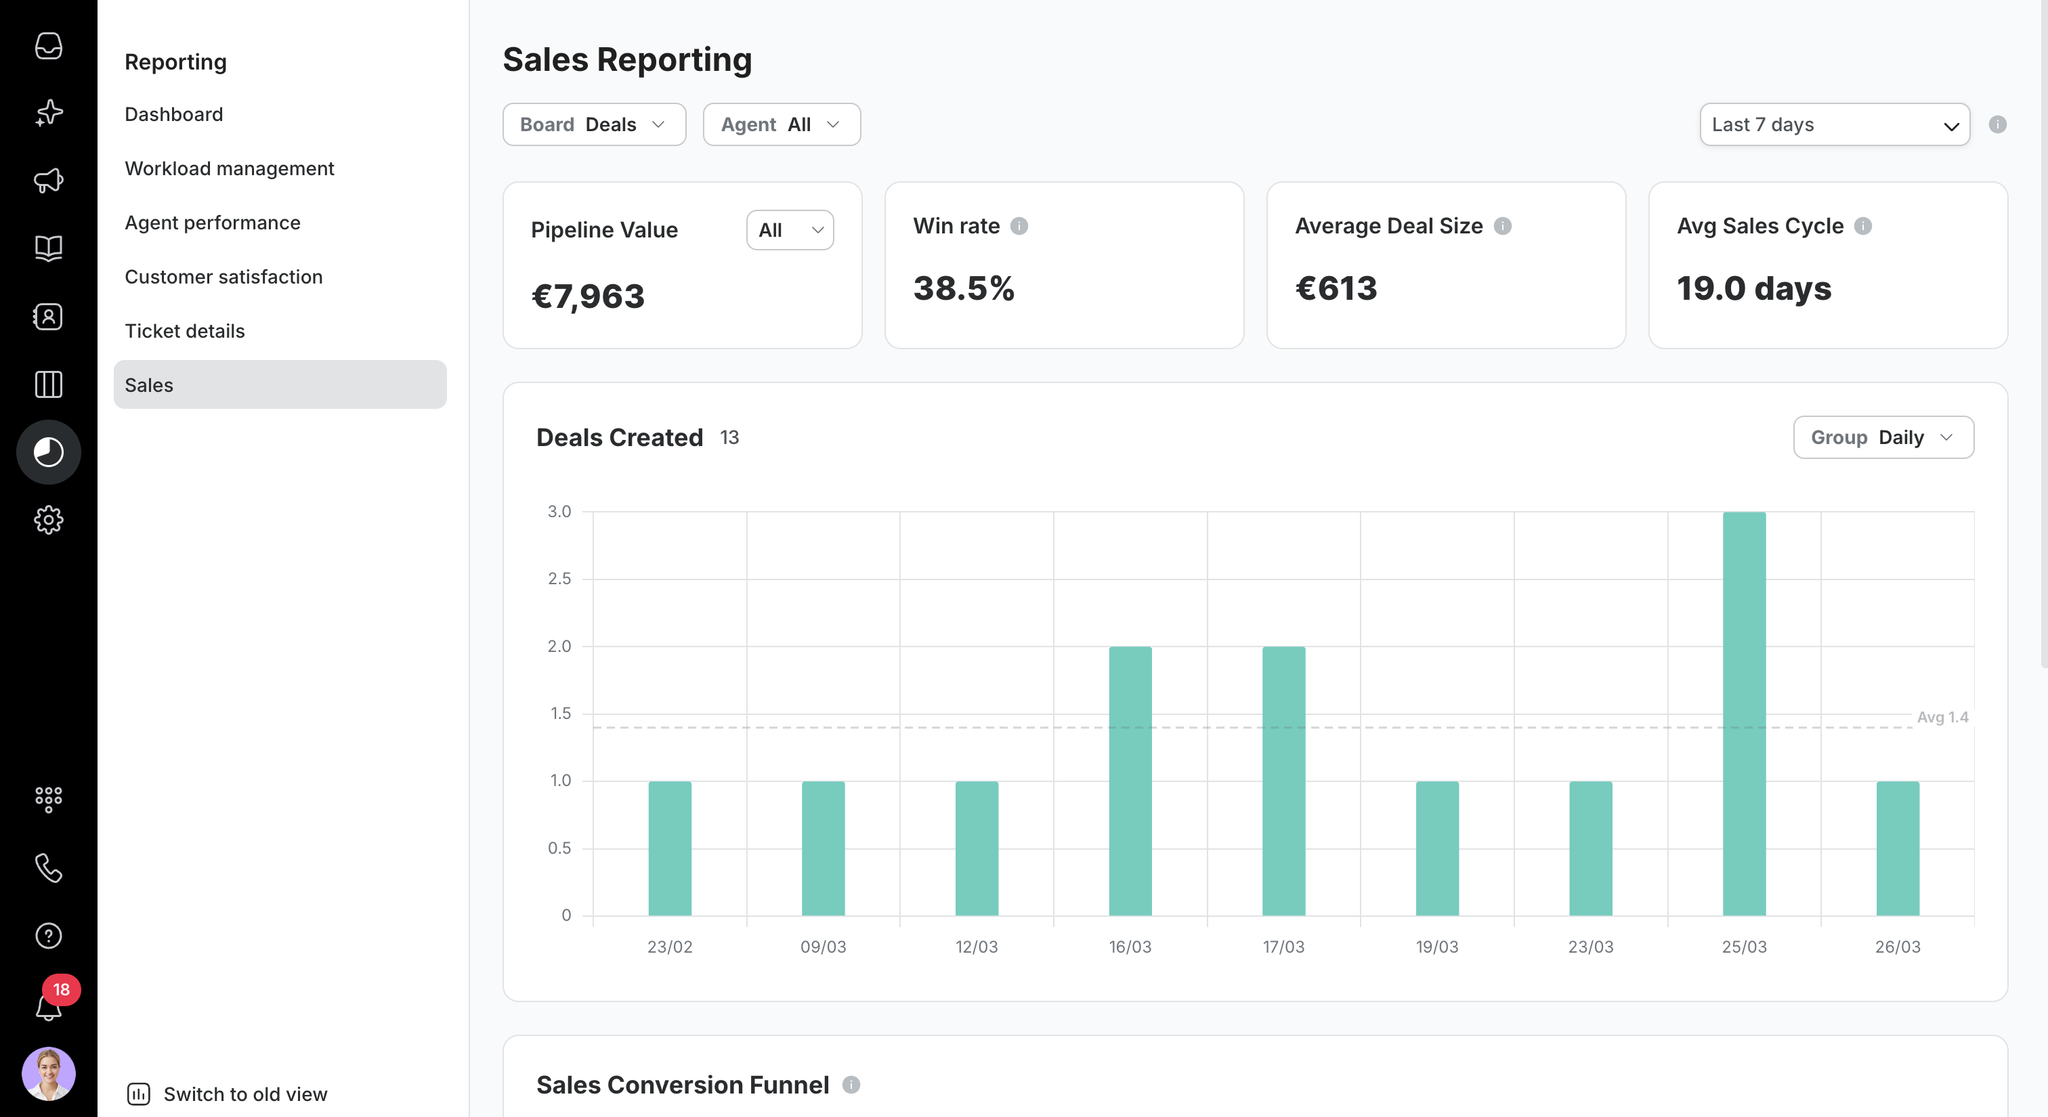
- Pipeline Value: Sum of all deal amounts on the selected board. In plain terms: everything in your pipeline regardless of status.
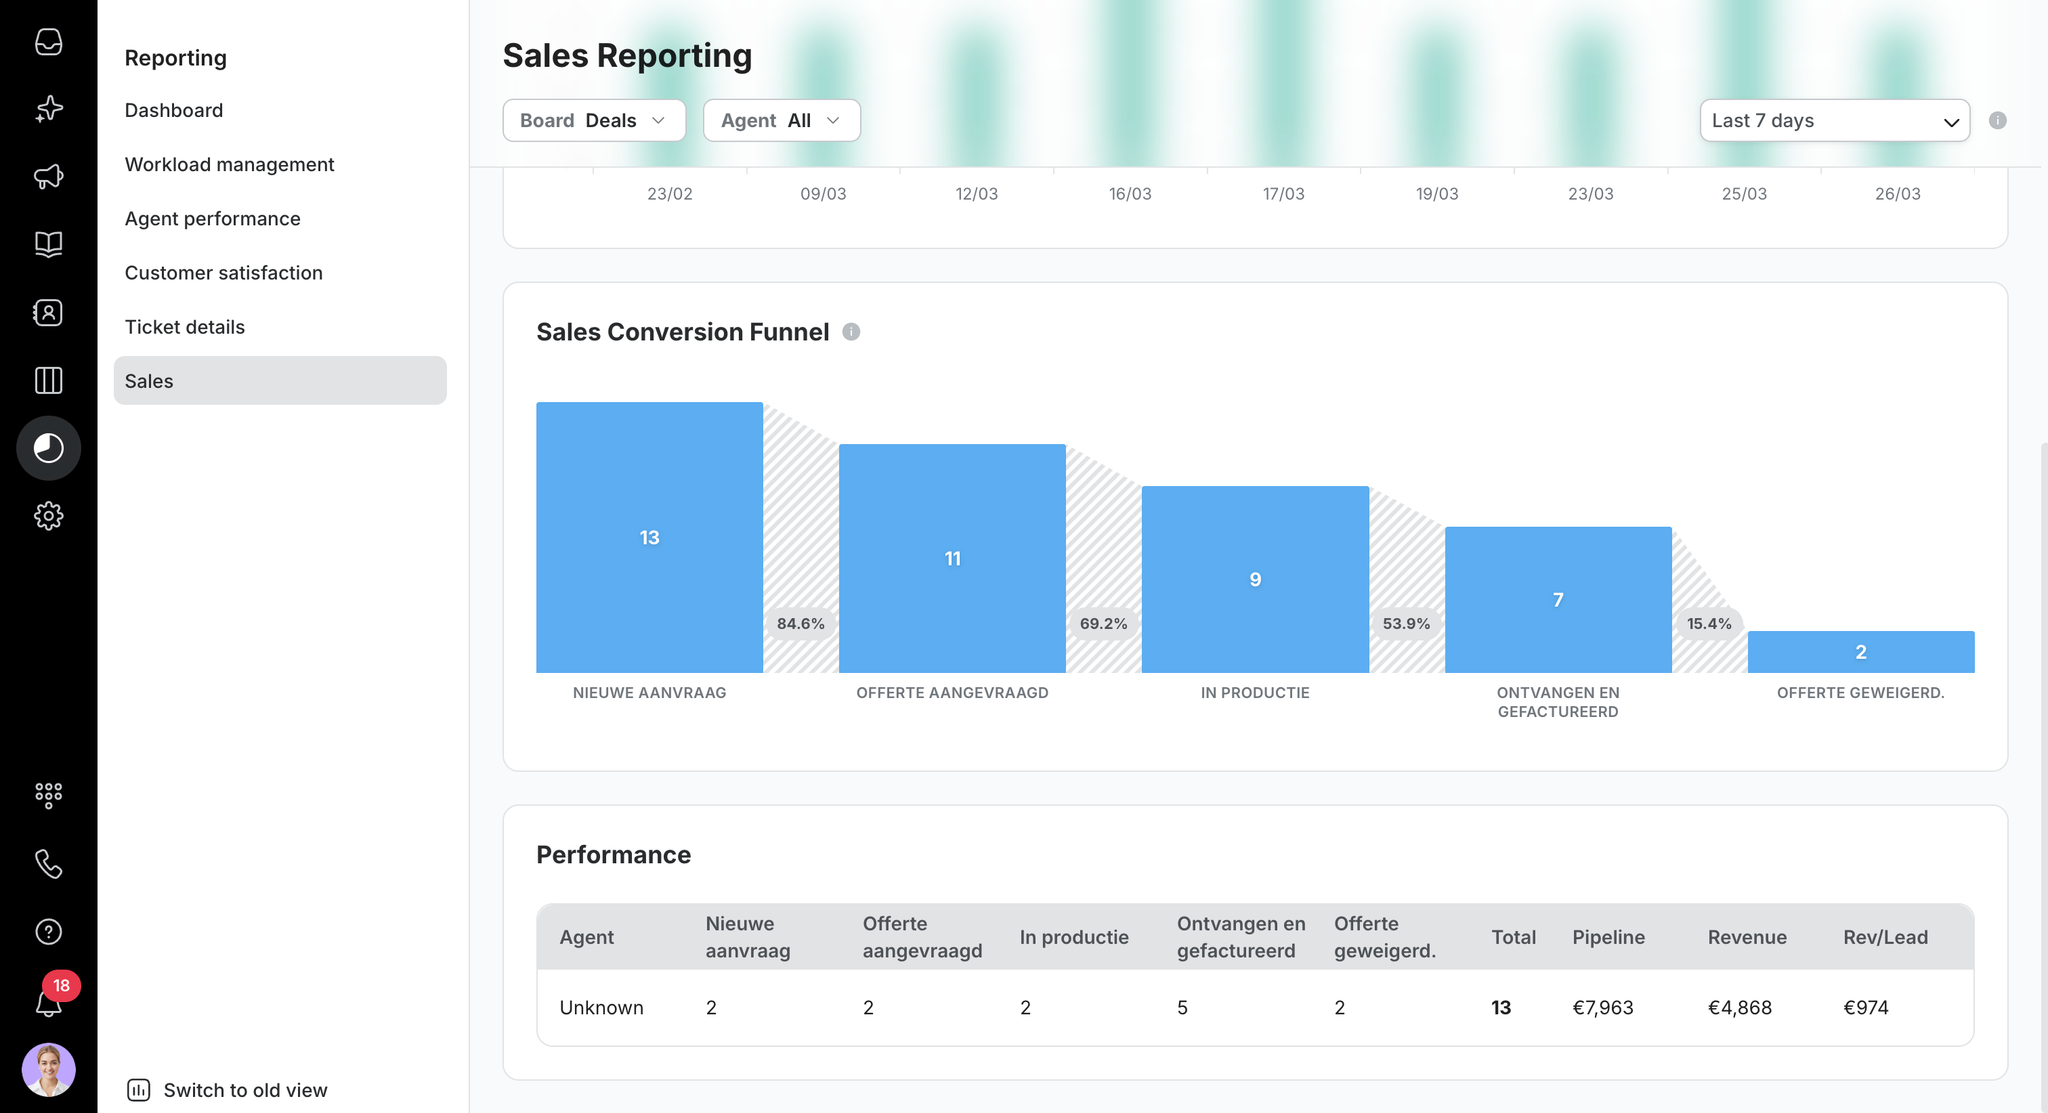
- Revenue: Total value of deals marked as "won" on the selected board.
- Average Won Deal Size: Total revenue from won deals divided by the number of unique won deals. So basically the average size of a closed deal.
- Average Sales Cycle: Average number of days from deal creation to close, only counting deals that have an actual close date recorded.
- Leads Created: Count of unique deal cards created on the selected board.
- Deal Stage Funnel: Shows the percentage of deals that reached each stage of the pipeline, broken down by stage name.
Filters for Sales Insights
The Sales Dashboard also provides you with the flexibility to apply filters for customised insights:
- By Board: See insights for a particular board as set up in Trengo.
- By Agent or Team: Monitor performance of an individual sales representative or a team.
Here is how it could look: